C2 results with the old CDR
The Sony data are slightly different than the ones showed in the previous pages, because I had to extract the test CD again after a bug was corrected in the analyse program (in version 1.3).
In green, the number of C2 reported errors, and in
blue, the number of undetected errors.
The top of the graphs are 88200 errors per second (all
data wrong). Each horizontal line means a factor of 2.
Thus the first line means 11 errors per second.
Memorex DVD Maxx 1648 firmware GWH2 DVD ROM
Sony DDU1621 DVD ROM firmware S1.6
First extraction, with analyse.exe version 1.2.
The graphs might be one or two pixels wrong.
Sony DDU1621 DVD ROM firmware S1.6
Second extraction, with analyse.exe version 1.4
Teac CD 540E firmware 1.0a CD ROM
Teac CD 540E firmware 3.0a CD ROM

All show a undetected error rate that is proportional to the number of C2 errors, exept the end of the Sony graphs. The blue curve are at least 4 lines below the green ones, not taking into account the isolated peaks in the Teac 3.0 graph, because, as the data is collected as an amount of events per unit of time, isolated peaks stands for a lower rate than a continuous line of the same peak amplitude. It means that the number of C2 errors is more than 16 times the number of undetected errors (each line being a factor 2 in the logarithmic scaling), so using the green curve as the full error rate instead of detected C2 rate means taking 16 instead of 16+1=17, that is the total error amount. Within this (17/16-1)x100=6% error, the fact that the undetected rate is roughly proportional to the total number of errors with only an accident in the Sony graph holds true.
In order to know what happened in this accident, let's open the reference wav and the test wav in a wave editor, copy the reference, and paste it over the test, but inverted, so that all matching data are substracted, and that only differences remain :

Fig 1 : differences between the original and
the Sony first extraction
This wave file, is in fact a graph of the errors, but
with a total accuracy. So that we can zoom into it and
display its spectrum.
The file being a little more than 79 minutes, and each
vertical line standing for one minute, the peaks in the
1.1 Sony file occured just after the 75th minute.
Let's zoom this part. Looking closely, a particular part
can be seen at this place :
Fig 2 : The error matching the C2 undetection
peak
Listening to it, the surrounding peaks are just noise, wile the thick part is a little bit of music. This is the part of the original extraction :
Fig 3 : The same error as in fig 2, but viewed
directly in the extracted wave instead of the computed
differences.
It is an interpolated error, but that is 1941 samples long ! There are two remarkable things about this error : it is about the same size as the longest muted part reported by the analysis (2169 samples), and it is interrupted by four samples (zoom below, the double lines are a SoundForge display artifact). The vertical accuracy of this picture is 2 steps (SoundForge 4.5 can't go further).
Fig 4 : Interruptions in the interpolation at the beginning of the error.
This error can be spotted, at 1 h 15 min 13 s, in the sonogram. It has some low frequency content, showed in red :
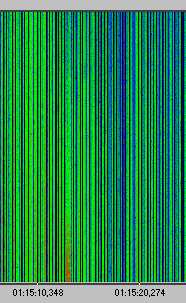
Fig 5 : Spectral view of the error
(differences with the reference file)
Let's see if other ones can be spotted in a larger analysis, playing with the settings :
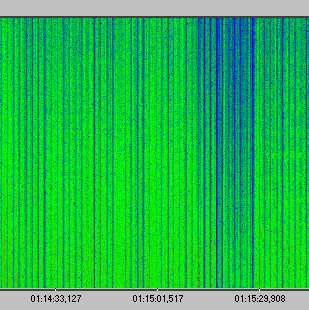
Fig 6 : Larger view of the aera with the error
(differences with the reference file)
Unfortunately, at this larger scale, the error is no more visible. So we can only suppose that the other peaks in the unreported errors graph represent big errors. I checked the ten first peak of the blue graph, in the DAT file, and they all match such an error in the wav. Anyway, we can listen to the file at this stage of error rate :
Hole.mp3, Lame alt-preset 128,
59 kB, 3 seconds.
Ref.mp3, same part from the
reference file, 60 kB
Scratches are audible all along, and the drop-out is very audible in the middle of the sample.
According to the DAT file, the error rate is about 22,000 per second. The Memorex stands higher error rates without such "holes" is the extracted data, but at this stage, I am tempted to say that it doesn't matter anymore, so much damage being affecting the sound.
In the second extraction, there were more errors, and
the C2 failure raised until 100% of the C2 reports, that
means that 50% of the errors were undetected. This occurs
when the curves are in the two top lines, therefore the
C2 rate and C2 failure rate are about 50% each, leading
to every extracted sample being wrong, with 50% of them
reported, and 50% unreported.
Here's how the wave looks like in this part :

Fig 7 : Errors from the zone where the
undetected rate is the highest (extracted wave)
The longest error is more than 4000 samples long.
The unexpected high peaks in the Sony C2 undetected errors match very long errors. When the errors are short (much less than 2000 consecutive samples), the C2 undetection is proportional to the C2 rate, as the blue curves suggest, but when the CD becomes too difficult to read, and errors are more than 2000 samples long, some C2 error information is missing from the Sony drive. According to the MP3 samples, this occurs at a stage where the audio data is severely corrupted, thus in rather hard conditions.
We can suppose that the drive is loosing the groove, and catching up later. In the meanwhile, C2 can't be detected, but the firmware developers may have forgotten to flag everything as erroneous in this case. However, we will see in the next section that this doesn't account for all the C2 problems.
Next : C2 accuracy analysis