C2 accuracy analisys
As said in the C2
results, we will study the accuracy of the C2 error
reporting of the drives, under normal conditions of error
correction (see the definition in the C2 results page).
Thus we need to filter the unsignificant data, and to
process the remaining ones in order to compute the C2
undetection rate versus the error rate. We will use
Microsoft Excel for this purpose.
You'll find how to analyse the data in Excel into the appendix 1
There are two possible kinds of graphs. I first used one-parameter graphs (the horizontal axis being defined by the record number of the Excel file) before finding the possibility of creating two-parameters graphs (a column plotted against another). However, the averaging process that we will use in order to reduce the statistical noise is easier in a one parameter study. So we will process the data with one parameter, and switch to two parameters only at the end.
Memorex DVD Maxx 1648 firmware GWH2 DVD ROM
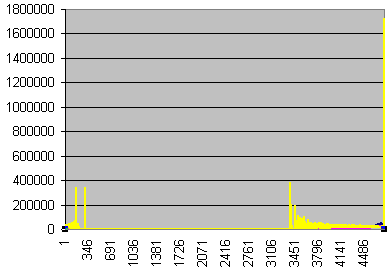
![]() Errors per second
Errors per second
![]() Undetected errors per second x100
Undetected errors per second x100
![]() Undetected errors per second/errors per
second x3,000,000
Undetected errors per second/errors per
second x3,000,000
Errors, undetected errors, and undetection ratio vs time
in seconds
The high yellow peaks screw the scaling. What are they
?
Let's search an example : line 3376, 8 errors, 1
undetected.
This comes from the fact that the numbers are too small
to provide a statistic sample. Let's sort the data on the
number of errors.
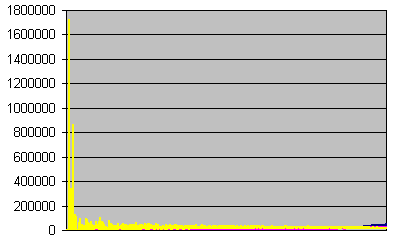
![]() Errors per second
Errors per second
![]() Undetected errors per second x100
Undetected errors per second x100
![]() Undetected errors per second/errors per
second x3,000,000
Undetected errors per second/errors per
second x3,000,000
Errors, undetected errors, and undetection ratio recorded
each second, sorted on errors Seconds with
zero errors have been discarded.
All the peaks in the undetection ratio come from recordings on too small statistic samples. We should eliminate them, but what if the undetection rate doesn't fall down with the error rate ? We must first analyse them as a whole. Let's cut the data into two parts. Here are the data with an error rate superior to 55 per second.
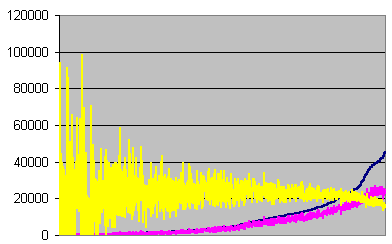
![]() Errors per second
Errors per second
![]() Undetected errors per second x100
Undetected errors per second x100
![]() Undetected errors per second/errors per
second x3,000,000
Undetected errors per second/errors per
second x3,000,000
Errors, undetected errors, and undetection ratio recorded
each second, sorted on errors, for error rate >=55
Here, we can see that the undetection ratio variations
decrease as the errors increase. That's not surprising,
granted that the number of undetected errors at the
beginning of the graph is often 0, 1, or 2. Let's check
the other part of the data, under 55 errors per second.
Any second showing 0 errors show 0 undetetced errors.
For the rest, between 1 and 54, we have a total of 1164
errors, and 15 undetected ones. That would give a yellow
plot around 38000 on the y-axis, rather to the left,
since 14 undetections are 1400 on the y-Axis for the pink
curve. This fits perfectly.
Thus the peaks in the undetection ratio are definitely statisical, and don't come from a defect of the drive.
Since the yellow curve varies very much, we must change the method of analyse. The problem comes from the fact that most recordings have a too small number of undetected errors. We must sum the recordings, the more recording we will sum, the more accurate will be the analysis, but the fewer the X-axis resolution will be. There are 1464 recording with an error rate superior to 54. Let's sum the cells by groups of 14, so that we keep an horizontal resolution of 100 on the graph, but increase the stability of the curves.
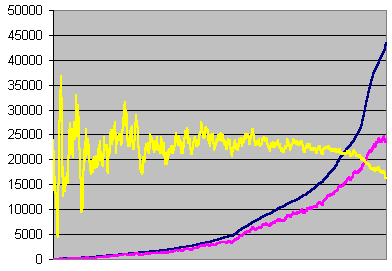
![]() Errors per second averaged on 14 seconds.
Errors per second averaged on 14 seconds.
![]() Undetected errors per second x100 averaged on
14 seconds
Undetected errors per second x100 averaged on
14 seconds
![]() Undetected errors per 14 seconds/errors per
14 seconds x3,000,000 for each second
Undetected errors per 14 seconds/errors per
14 seconds x3,000,000 for each second
Errors, undetected errors, and undetection
ratio recorded each second, averaged on 14 seconds,
sorted on errors, for error rate >=55 per second.
This graph is 330 pixels wide, so the horizontal accuracy is about 3 pixels.
We've seen that its variatons on the left part of the graph are statistical. In order to get an accurate ratio for lower error rates, we must collect about 5,000x14 = 70,000 errors (because the yellow curve becomes stable when the blue one is around 5,000). But an artifact in the data comes into play. Look at this line
| Time (min) | C2 (s-1) |
Fake C2 (s-1) |
Undetected (s-1) |
| 79.60000000 | 40322 | 40319 | 4 |
We're in the low error rates : there are 7 errors only
(40322+4-40319). But 40,322 are reported ! How is it
possible ?
The time gives the answer. We are 79.6 minutes into the
wav. That is in plain digital silence. It is the end of
the CD, that is very damaged, thus featuring many errors
(about 40,000 per second), but the interpolation of these
errors generates only null samples, since the drive just
holds the last good value, that is always zero. Therefore
the analyse program doesn't detect them as errors, since
all samples are perfectly correct... by chance !
Let's discard these data from the analysis, since we want
to analyse data read for low error rates only.
Note that the effect of digital silence in the analysis
is very little, since we are comparing the ratio between
undetected errors and the total number of errors. The
problem of interpolation in the digital silence makes us
assume that there are very few errors, but the undetected
errors taken into account are necessarily part of them. A
lack of C2 into an interpolated error is considered as a
normal successful reading, and the presence of C2 as C2
overdetection, that we don't analyse, since it doesn't
affect the secureness of the extracton.
Thus the only effect is translating the good undetected
errors ratio from its actual error rate to very low error
rates. but we especially discarded this kind of report
for the low error rate measurment, and it doesn't affect
the ratio computed for high error rates.
Let's manually select clusters of records featuring at
least 70,000 errors each, until we cover all the range
where the graph is unaccurate.
| Records selected | Error rates covered | Errors total | Undetected errors total | Undetected/Errors x3000000 |
Average error rate |
| 1-296 | 3-654 | 70545 | 481 | 20455 | 240 |
| 297-380 | 661-1012 | 70373 | 569 | 24256 | 838 |
| 381-441 | 1017-1298 | 70286 | 596 | 25439 | 1152 |
| 442-491 | 1305-1496 | 70180 | 475 | 20304 | 1404 |
These results can be manually typed into the undetection ratio column in order to replace the data for low error rates. The new graph has four yellow dots on the left replacing the original data, but with much more accuracy.
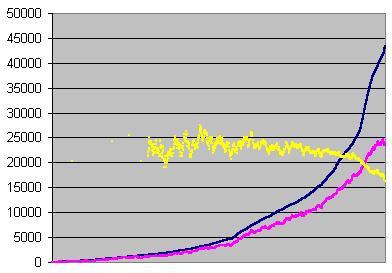
![]() Errors per second averaged on 14 seconds.
Errors per second averaged on 14 seconds.
![]() Undetected errors per second x100 averaged on
14 seconds
Undetected errors per second x100 averaged on
14 seconds
![]() Undetected errors/errors x3,000,000 for each
second averaged on 70000 errors (error rate <1498) or
14 seconds (>=1498).
Undetected errors/errors x3,000,000 for each
second averaged on 70000 errors (error rate <1498) or
14 seconds (>=1498).
Errors, undetected errors, and undetection
ratio recorded each second, averaged on 14 seconds or
70000 errors, sorted on errors
Now we can plot directly the C2 accuracy against the error rate.
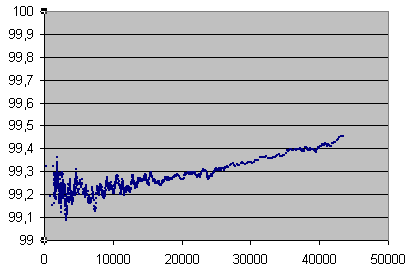
C2 accuracy in %, averaged on 70000 errors under 1498 errors per seconds, and on 14 seconds beyond, vs error rate in mono samples
Sony DDU1621 DVD ROM firmware S1.6
Since Analyse.exe 1.2 was bugged, we'll use the data returned by version 1.4 (second Sony graph in the C2 results page). As we previously said in that page, we will discard all the high error rate part, because, the CD being too damaged, some very long burst errors appeared which turned the extracted wav file unusable, while the C2 reporting stopped working.
Study of the C2 anomalies
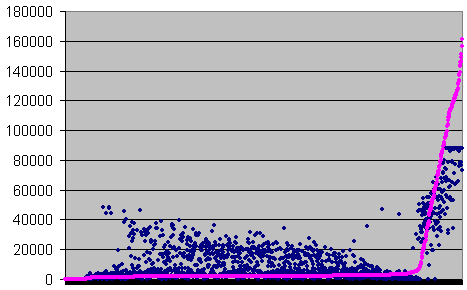
![]() Errors per second
Errors per second
![]() Undetected errors/errors x 300,000 for each
second
Undetected errors/errors x 300,000 for each
second
Errors and undetected errors/errors ratio
recorded each second, sorted on ratio, for error rate
>0
The point where the pink curve starts to rise is the
point where the long burst errors appear, that is where
the drive is supposed to loose the groove. From this
point, the undetection rate grows progressively, because
the data are collected for whole seconds of music.
Therefore at the beginning, the burst errors being a few,
they contribute little to the total undetection, because
they fill only a little part of the 88200 samples
collected each second. Then, as their number increase
progressively, the number of undetected errors grows with
them, rather than with the random error rate, because,
when burst errors are a significant part of the extracted
data, nearly all the undetections come from them..
The blue dots are the numbers of errors. They are clearly
divided into two clusters. The cluster on the right
stands for a high error rate, and match high undetection
ratios. It is the burst errors. The one at the bottom
stands for low error rates, and match low undetection
ratios. This is the part we are interested in. We can
already see that the error rates increases to the left,
thus the undetection ratio decreases as the error rate
increase, like with the Memorex. There are blue dots at
the very bottom for all low undetection ratios, because
at low error rates, the statistical samples are little,
and the ratio oscillates randomly, covering all low
values.
There are some blue dots on the left of the right
cluster. Especially two of them, that stands for a high
error rate, but a low undetection ratio. Maybe they are
worth studying. According to Excel, one of them is the
recordings for 78'12".
Here are the waves :
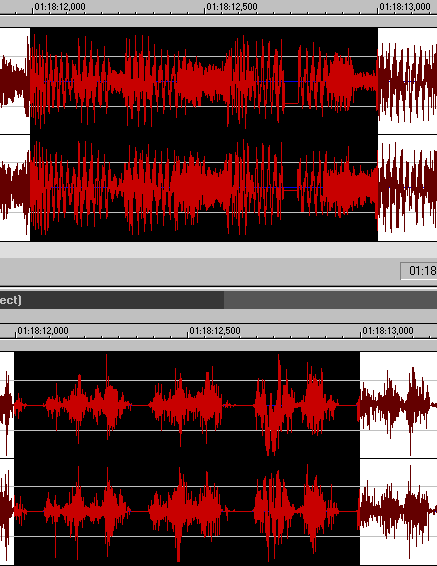
Extracted wave (up) and its differences from
the original between 78'12" and 78'13"
The burst error visible in the wave is about 1700 samples
long.
The data are 43,533 errors, 480 undetected. According to
the graph, for this error rate, the undetection ratio is
usually bigger.
Looking in the wave, we can see some entire seconds of
data without any burst error in them. At 78'13", for
example. Since there is no burst error, the undetection
should be very lower. The data gives 44,430 errors, 217
undetected. Thus in fact, it is a blue dot that is on the
complete left of the graph, at about the same level. What
about the following second ? 63,614 errors, 15,202
undetections, about 4,000 samples of burst errors.
Here, the undetections are bigger than the burst errors !
Therefore the idea of a bug in the firmware that would be related to the burst errors doesn't stand anymore. Once the error rate is too big, the C2 reporting doesn't work properly anymore.
C2 accuracy
| Records selected | Error rates covered | Errors total | Average error rate | Undetected errors total | C2 accuracy (%) |
| 1-252 | 7-753 | 70112 | 278 | 513 | 99.268 |
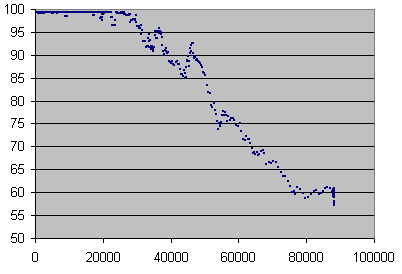
C2 accuracy in %, averaged on 70,000 errors under 753 errors per seconds, and on 14 seconds beyond, over error rate in mono samples
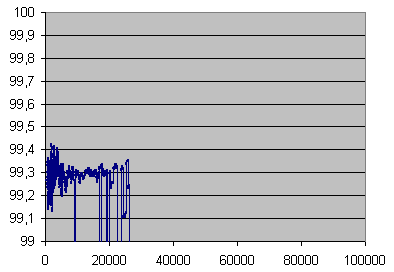
Close up of the above
Teac CD 540E firmware 1.0a CD ROM
| Records selected | Error rates covered | Errors total | Average error rate | Undetected errors total | C2 accuracy (%) |
| 1-706 | 2-462 | 70166 | 99 | 21 | 99.970 |
| 707-824 | 462-731 | 70225 | 595 | 49 | 99.930 |
| 825-906 | 737-1015 | 70897 | 865 | 66 | 99.907 |
| 907-966 | 1017-1360 | 70254 | 1171 | 37 | 99.947 |
| 967-1011 | 1395-1770 | 70548 | 1568 | 74 | 99.895 |
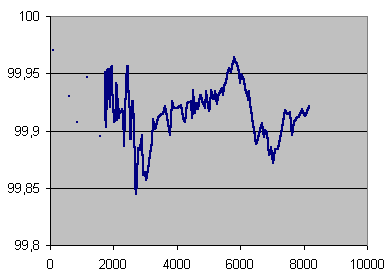
C2 accuracy in %, averaged on 70,000 errors under 1770 errors per seconds, and on 14 seconds beyond, over error rate in mono samples
Teac CD 540E firmware 3.0a CD ROM
| Records selected | Error rates covered | Errors total | Average error rate | Undetected errors total | C2 accuracy (%) |
| 1-1003 | 2-983 | 200406 | 200 | 107 | 99.947 |
| 1004-1144 | 985-2114 | 200069 | 1419 | 112 | 99.944 |
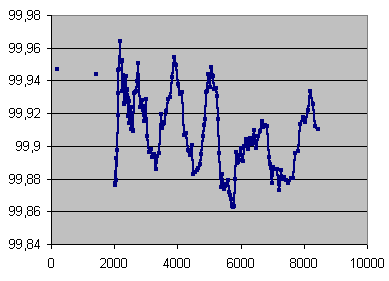
C2 accuracy in %, averaged on 200,000 errors under 2114 errors per seconds, and on 14 seconds beyond, over error rate in mono samples
Next : Error correction analysis