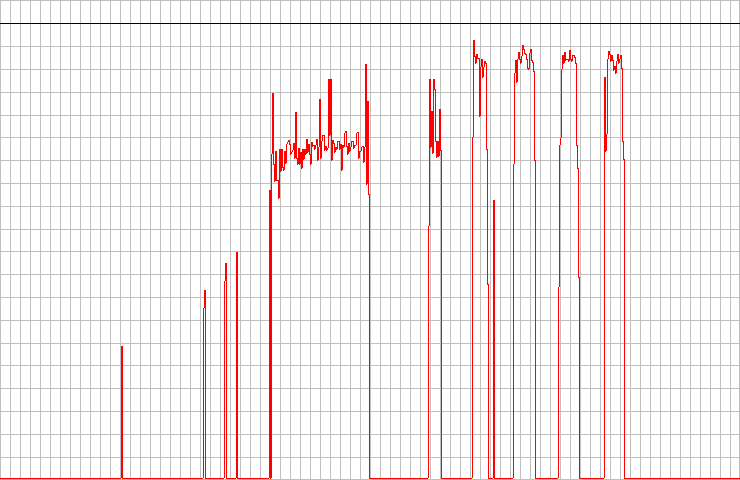
C2 results with DAEQuality test CD
Analyse version 1.2
Memorex DVD Maxx 1648 firmware GWH2 DVD ROM
Errors total Num : 56075980
Errors (Loudness) Num : 141799 - Avg : -27.6 dB(A) - Max
: -4.6 dB(A)
Error Muting Num : 32915 - Avg : 328.6 Samples - Max :
1920 Samples
Skips Num : 51 - Avg : 58.4 Samples - Max : 1189 Samples
Total Test Result : 52.6 points (of 100.0 maximum)}

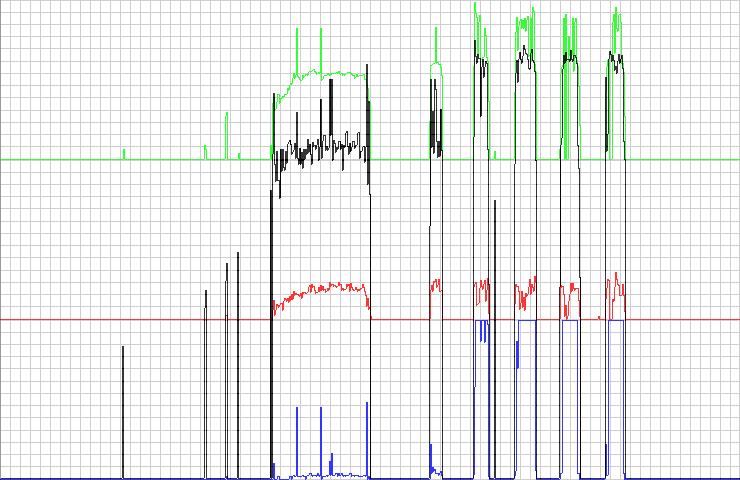
I pasted this picture over the C2 one :

The Sony has not worked properly since I flashed the 1.7 firmware in it, and the Yamaha doesn't support C2 info.
What is interesting is the blue part : undetected
errors.
During the first part (the black mark on the CD), the
average level of undetected errors is low, but shows 5
peaks. They match exactly the 5 black peaks (real
errors). I won't comment them, because I don't have the
wav files left and therefore can't look at what happened.
To analyse the data, I imported the DAT file into
Microsoft Excel, as explained in Appendix 1.
In order not to take the peaks into account, after having
kept only the part matching the black mark on the CD, I
sorted the data on the undetected errors column and
deleted the 6 rows with the peak data.
Without the peaks, there are 357137 detected errors,
and 286 undetected ones, that is one for 1250, in this
part.
The data are given for each second.
The 400 seconds in which there were no undetected errors
totalized 184562 C2 errors
The 149 seconds in which there were 1 undetected errors
totalized 115621 C2 errors
The 52 seconds in which there were 2 undetected errors
totalized 46568 C2 errors
The 11 seconds in which there were 3 undetected errors
totalized 10388 C2 errors
Which leads to
| Undetected error rate (per s) |
Number of seconds | Total of undetected errors |
C2 errors | Total errors | Undetection ratio |
| 0 | 400 | 0 | 184562 | 184562 | 0 |
| 1 | 149 | 149 | 115621 | 115770 | 1.29x10e-3 |
| 2 | 52 | 104 | 46568 | 46672 | 2.23x10e-3 |
| 3 | 11 | 33 | 10388 | 10421 | 3.17x10e-3 |
The undetection ratio rises with the undetection rate, which means that the undetected error rate grows faster than the error rate.
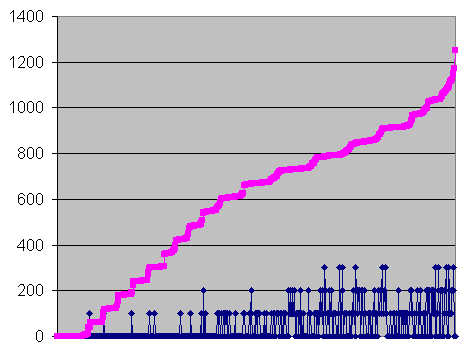
Here's the graph, made with Excel,

Errors and undetected errors for each second in the black mark range on the CD, without the peaks, sorted by number of errors
![]() Errors per second, for every second.
Errors per second, for every second.
![]() Undetected
errors per second (that is 0, 1, 2, or 3) x100
Undetected
errors per second (that is 0, 1, 2, or 3) x100
What if the undetected errors were actually detected, but misplaced ? We should then have an "overdetected" rate that would be the same as the detected rate. However, the original graph shows that the overdetection rate, in red, is much higher than the undetection one. This doesn't answers the question. Anyway, for the user, the result is the same : some errors are not properly reported.
Next : DAE results with the old CDR